Group Financial Highlights (FY2020)
Financial Highlights
| FINANCIAL YEAR ENDED 31 DECEMBER | ||||||||||||
|---|---|---|---|---|---|---|---|---|---|---|---|---|
| 2016 | 2017* | 2018 | 2019 | 2020 | ||||||||
| INCOME (RM’000) | ||||||||||||
| i. | Revenue | 4,891,714 | 5,293,993 | 6,246,519 | 7,096,067 | 5,850,326 | ||||||
| ii. | Profit before tax and interest | 1,364,423 | 1,508,877 | 1,558,123 | 1,710,592 | 1,310,656 | ||||||
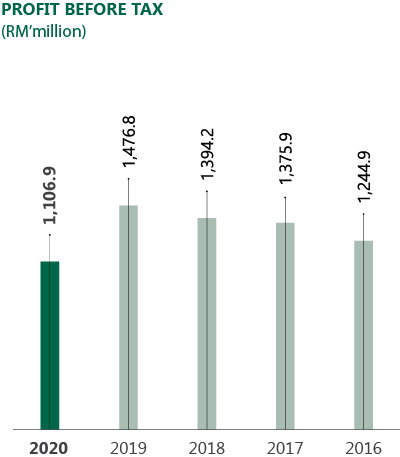
| iii. | Profit before tax | 1,244,935 | 1,375,897 | 1,394,178 | 1,476,813 | 1,106,935 | ||||||
| iv. | Profit attributable to owners of the Company | 1,000,960 | 1,098,923 | 1,145,608 | 1,162,871 | 750,179 | ||||||
| FINANCIAL POSITION (RM’000) | ||||||||||||
| Assets | ||||||||||||
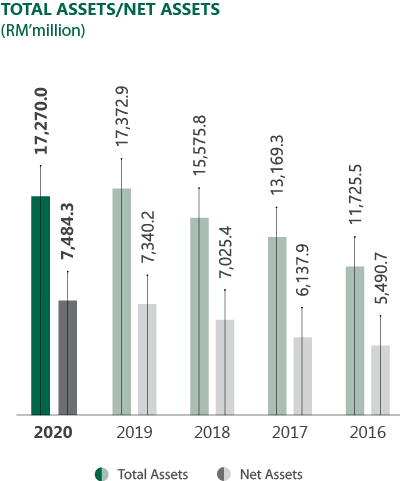
| i. | Total assets | 11,725,461 | 13,169,322 | 15,575,804 | 17,372,884 | 17,269,962 | ||||||
| ii. | Net assets | 5,490,676 | 6,137,861 | 7,025,388 | 7,340,166 | 7,484,328 | ||||||
| iii. | Current assets | 5,105,674 | 5,397,418 | 7,092,661 | 7,878,204 | 8,324,346 | ||||||
| Liabilities | ||||||||||||
| i. | Current liabilities | 3,433,667 | 3,976,766 | 3,832,530 | 5,022,768 | 4,542,273 | ||||||
| ii. | Borrowings | 4,425,247 | 4,478,875 | 5,428,983 | 6,381,186 | 6,490,655 | ||||||
| iii. | Borrowings (net of money market deposits and cash) | 3,386,227 | 3,739,628 | 3,788,635 | 4,073,624 | 3,505,735 | ||||||
| Shareholders’ Equity | ||||||||||||
| i. | Paid-up share capital | 2,489,682 | 3,519,554 | 3,519,554 | 3,519,554 | 3,519,554 | ||||||
| ii. | Shareholders' equity | 5,490,676 | 6,137,861 | 7,025,388 | 7,340,166 | 7,484,328 | ||||||
| iii. | Total equity | 6,122,455 | 7,107,201 | 8,296,743 | 8,618,856 | 8,657,593 | ||||||
| iv. | Total equity (excluding intangible assets) | 6,037,306 | 7,070,465 | 8,243,896 | 8,575,053 | 8,619,555 | ||||||
| Number of shares | ||||||||||||
| - Weighted average share in issue net of treasury shares ('000) | 2,362,902 | 2,489,679 | 2,489,674 | 2,489,670 | 2,489,670 | |||||||
| - Shares in issue net of treasury shares ('000) | 2,489,680 | 2,489,676 | 2,489,672 | 2,489,670 | 2,489,670 | |||||||
| SHARE INFORMATION | ||||||||||||
| Per Share | ||||||||||||
| i. | Basic earnings (sen) # | 42.36 | 44.14 | 46.01 | 46.71 | 30.13 | ||||||
| ii. | Net assets (RM) @ | 2.21 | 2.47 | 2.82 | 2.95 | 3.01 | ||||||
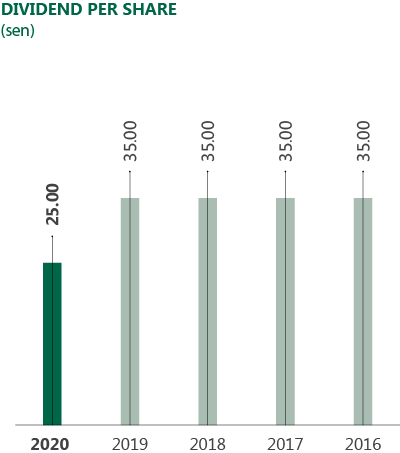
| iii. | Dividend (sen) | 35.00 | 35.00 | 35.00 | 35.00 | 25.00 | ||||||
| iv. | Share price | |||||||||||
| - Year High (RM) | 8.93 | 9.79 | 10.20 | 10.26 | 10.08 | |||||||
| - Year Low (RM) | 6.40 | 8.53 | 8.70 | 9.45 | 6.70 | |||||||
| - as at 31 December (RM) | 8.86 | 9.55 | 9.85 | 9.98 | 8.60 | |||||||
| v. | Market capitalisation (RM’000) | 22,058,561 | 23,776,406 | 24,523,269 | 24,846,907 | 21,411,162 | ||||||
| vi. | Trading volume (’000) | 362,662 | 101,444 | 120,484 | 102,267 | 119,031 | ||||||
| FINANCIAL RATIOS | ||||||||||||
| i. | Return on total assets (%) | 8.54 | 8.34 | 7.36 | 6.69 | 4.34 | ||||||
| ii. | Return on shareholders’ equity (%) | 18.23 | 17.90 | 16.31 | 15.84 | 10.02 | ||||||
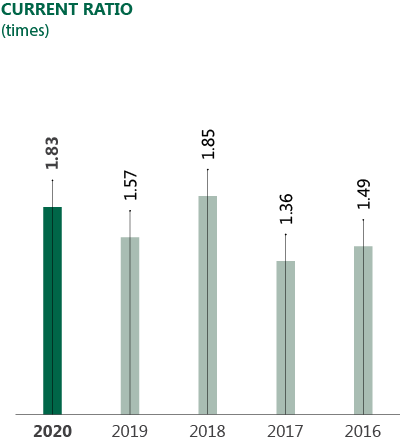
| iii. | Current ratio (times) | 1.49 | 1.36 | 1.85 | 1.57 | 1.83 | ||||||
| iv. | Net Debt-to-Equity ratio (times) ^ | 0.56 | 0.53 | 0.46 | 0.48 | 0.41 | ||||||
Notes:
Dividend per Share

Shareholders’ Equity

Current Ratio

Net Debt-To-Equity Ratio

Revenue

Profit Before Tax

Total Assets / Net Assets

Basic Earnings per Share / Net Assets per Share
